

Screw Compressor Market Size: Segment Valuations in an Efficiency-Driven Category

Industrial equipment markets tied to energy efficiency behave differently from those tied to production volume: demand can grow even when industrial output is flat, because the replacement decision is driven by operating cost rather than capacity need. The Screw Compressor Market Size reflects that profile—a large baseline, steady growth, and segment values that reveal where efficiency investment concentrates. According to Market Research Future, the market was valued at approximately USD 11.40 billion in 2025, opens the forecast window at USD 12.02 billion in 2026, and is projected to reach USD 19.30 billion by 2035 at a CAGR of 5.4%.
Establishing the Baseline
The 2025 valuation of approximately USD 11.40 billion establishes the category's scale. Three characteristics define it:
-
It is a large industrial equipment category spanning oil-injected and oil-free technologies across fixed and variable speed
-
It serves manufacturing, oil and gas, food and beverage, pharmaceuticals, automotive, construction and mining, chemicals, and power end uses
-
Revenue combines equipment sales with aftermarket parts and service—the latter generating materially higher margins
The Growth Trajectory
The projected 2035 valuation of approximately USD 19.30 billion represents growth of roughly 69% over the 2025 baseline across ten years.
| Year | Market Size (USD Billion) |
|---|---|
| 2025 | 11.40 |
| 2026 | 12.02 |
| 2035 | 19.30 |
At a CAGR of 5.4%, the market expands above general industrial equipment growth—driven by efficiency regulation, electricity cost escalation, and Asia-Pacific capacity build-out operating in parallel.
Segment-Level Valuations
The research provides specific valuations and shares that reveal where value concentrates.
By Technology
| Segment | Metric |
|---|---|
| Oil-Injected (largest) | 68% share (2025) |
| Oil-Free (fastest-growing) | 6.6% CAGR |
Oil-injected units command approximately 68% of 2025 revenue as the default across general manufacturing and workshop duty. Oil-free machines post the strongest technology-level growth at approximately 6.6% CAGR, pulled by food, beverage, and sterile pharmaceutical air. Notably, the research observes the specific energy consumption gap between the two has narrowed considerably as water-injected and coated-rotor designs mature.
By Drive Type
| Segment | Metric |
|---|---|
| Fixed Speed (largest) | 58% share (2025) |
| Variable Speed Drive (fastest-growing) | 7.1% CAGR |
Fixed speed holds approximately 58% share serving stable base-load applications. Variable speed drive grows at approximately 7.1% CAGR as tariff structures penalise part-load waste—with plants recording significant energy reduction after conversion where demand swings are substantial.
By Power Rating
| Segment | Metric |
|---|---|
| Below 50 kW (largest by value) | USD 3.31 billion (2025) |
| 50–250 kW | 46% share (2025) |
| Above 250 kW (fastest-growing) | 5.1% CAGR |
Below 50 kW holds the largest valuation at approximately USD 3.31 billion through workshops and small-batch manufacturing. The 50–250 kW band holds approximately 46% share as main plant air supply. Above 250 kW grows at approximately 5.1% CAGR through petrochemicals, mining, and process industries.
Reconciliation note: Below 50 kW at USD 3.31 billion represents approximately 29% of the USD 11.40 billion 2025 market, while the 50–250 kW band holds 46% share (approximately USD 5.24 billion). Together these two bands account for approximately 75% of the market, leaving approximately 25% for above-250 kW and any unclassified capacity—internally consistent.
By End-User Industry
| Segment | Metric |
|---|---|
| Manufacturing & Metal Fabrication (largest) | 31% share (2025) |
| Oil & Gas | USD 2.05 billion (2025) |
| Automotive | 11% share (2025) |
| Construction & Mining | USD 1.14 billion (2025) |
| Chemicals, Power & Others | 9% share (2025) |
| Pharmaceuticals (fastest-growing) | 6.9% CAGR |
| Food & Beverage | 6.4% CAGR |
Manufacturing and metal fabrication anchor the market at approximately 31% share through breadth of pneumatic tooling. Oil and gas contributes approximately USD 2.05 billion concentrated in gathering, instrument air, and process duty. Pharmaceuticals grow fastest at approximately 6.9%.
Regional Distribution of Value
| Region | Metric (2025) |
|---|---|
| Asia-Pacific (largest) | 41.5% share |
| Europe | USD 2.74 billion |
| North America | 22.5% share |
| South America (fastest-growing) | 5.9% CAGR |
| Middle East & Africa (fastest-growing) | 6.8% CAGR |
Asia-Pacific holds approximately 41.5% of global revenue, with China at 48% of regional revenue, India growing at approximately 8.1% CAGR, Japan contributing approximately USD 0.61 billion, South Korea holding 8% of regional revenue, and the rest of Asia-Pacific at 11%.
Europe generated approximately USD 2.74 billion, with Germany at 27% of regional revenue, Italy at approximately USD 0.33 billion, the UK growing at approximately 4.9% CAGR, and France holding 12%.
North America holds approximately 22.5% share, with the United States at 79% of regional revenue, Canada at approximately USD 0.36 billion, and Mexico growing at approximately 6.4% CAGR.
South America grows at approximately 5.9% CAGR, with Brazil at 62% of regional revenue, Argentina at approximately USD 0.09 billion, and Chile growing at approximately 5.6% CAGR. Middle East and Africa grows fastest at approximately 6.8% CAGR, with Saudi Arabia at 34% of regional revenue, the UAE growing at approximately 7.3% CAGR, and South Africa at approximately USD 0.13 billion.
Quantified Driver Impact
| Driver | Impact on CAGR |
|---|---|
| Motor efficiency regulation (IE4/IE5) | +0.9 |
| Industrial electricity cost escalation | +0.8 |
| Asia-Pacific manufacturing capacity build-out | +0.7 |
| Contamination-free air mandates in food and pharma | +0.6 |
| Air-as-a-service and long-term service contracts | +0.4 |
| Predictive maintenance and connected controllers | +0.3 |
| Green hydrogen and industrial gas handling | +0.3 |
Motor efficiency regulation carries the heaviest weight, reflecting that a significant installed base of fixed-speed packages was stranded when efficiency floors rose—forcing replacement rather than encouraging it.
Quantified Restraint Impact
| Restraint | Impact on CAGR |
|---|---|
| Capital cost premium versus reciprocating units | −0.5 |
| European industrial output softness | −0.4 |
| Aftermarket commoditisation and grey-market parts | −0.3 |
| Demand-side efficiency programmes reducing air volume | −0.3 |
| Motor and rare-earth supply chain volatility | −0.2 |
Capital cost premium is the heaviest restraint, with piston packages substantially cheaper below a threshold—and distributors reporting that financing availability, not technology, determines the purchase decision in cost-sensitive markets.
Reading the Figures Critically
Four caveats apply.
Driver and restraint weightings are directional, not additive. The research presents driver impacts as percentage-point contributions and restraint impacts as percentage-point drags. A reader should not sum drivers and subtract restraints to derive 5.4%—the figures indicate relative importance rather than arithmetic components.
Segment shares are cross-dimensional. Oil-injected's 68%, fixed-speed's 58%, the 50–250 kW band's 46%, manufacturing's 31%, and Asia-Pacific's 41.5% each describe the same market from different angles—a single unit is simultaneously a technology, a drive type, a power band, serving a sector, sold in a region. Adding them produces no meaningful total.
The leak paradox limits volume growth. The research notes the same efficiency agenda that drives premium sales also shrinks air demand—plants fixing distribution losses often downsize the next machine by a full frame size. Revenue growth therefore understates value-per-unit improvement and overstates capacity deployed.
Restraint on European demand is cyclical, not structural. The research identifies European industrial output softness as the swing variable for European volumes until later in the decade—recovery timing rather than regulation determines that region's trajectory.
Conclusion
The market size narrative is one of efficiency-driven expansion: from approximately USD 11.40 billion in 2025 toward USD 19.30 billion by 2035. Beneath the headline, the structure is clear—oil-injected holds technology share while oil-free accelerates, fixed speed holds drive share while variable speed grows, the 50–250 kW band anchors volume while above-250 kW accelerates, manufacturing drives sector value while pharmaceuticals grow fastest, and Asia-Pacific anchors scale while Middle East and Africa grow fastest. For manufacturers planning capacity and investors assessing the sector, the service and heat recovery trajectories matter more than the aggregate figure.
Hybrid Turbocharger For Marine Engine Market
Industrial Air Quality Control System Market
Completion Equipment and Service Market
Industrial Demand Response Management System Market
Industrial Electrical Component Market
Deep Water and Ultra Deep Water Exploration Production Market
High Voltage Measuring Equipment Market
Ground Mount PV Utility Market
Kategorien
Mehr lesen
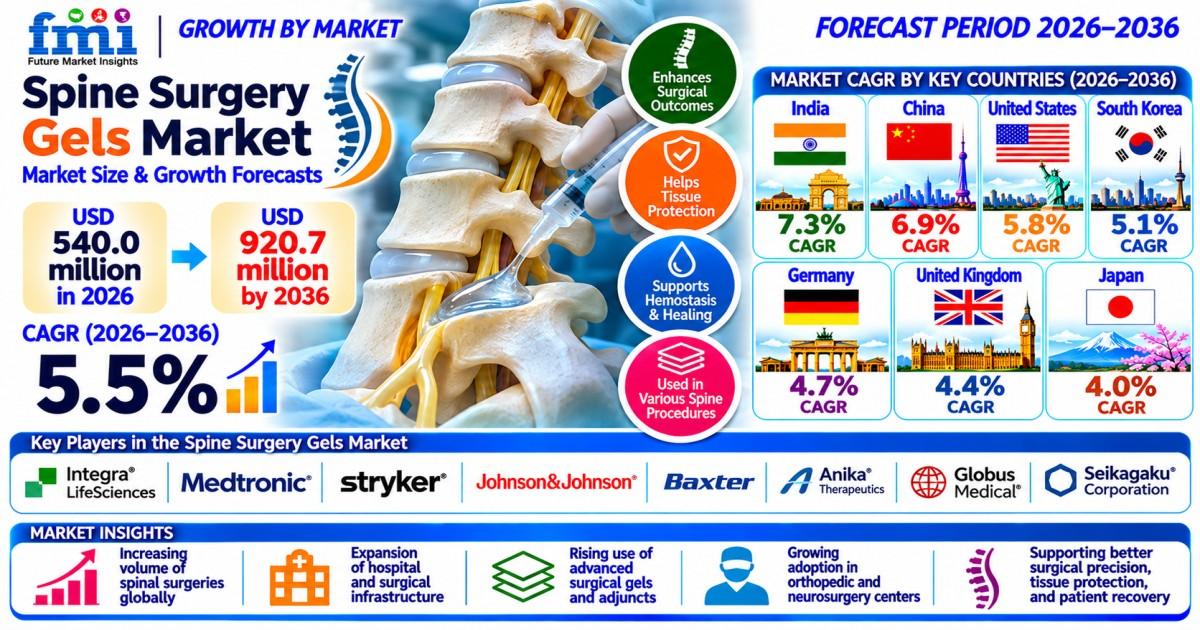
The global spine surgery gels market is estimated to reach USD 540.0 million in 2026 and is projected to expand to USD 920.7 million by 2036. According to new research published by Future Market Insights, Inc., the market is forecast to grow at a compound annual growth rate (CAGR) of 5.5% between 2026 and 2036, generating an incremental opportunity of USD 380.7 million. Market expansion is...
Rare diseases are receiving increasing attention from pharmaceutical companies, healthcare organizations, and biotechnology researchers. Although individual rare conditions affect relatively small patient populations, their treatment requirements can be complex and highly specialized. Inherited coagulation disorders are an important example, creating demand for therapies that address specific...

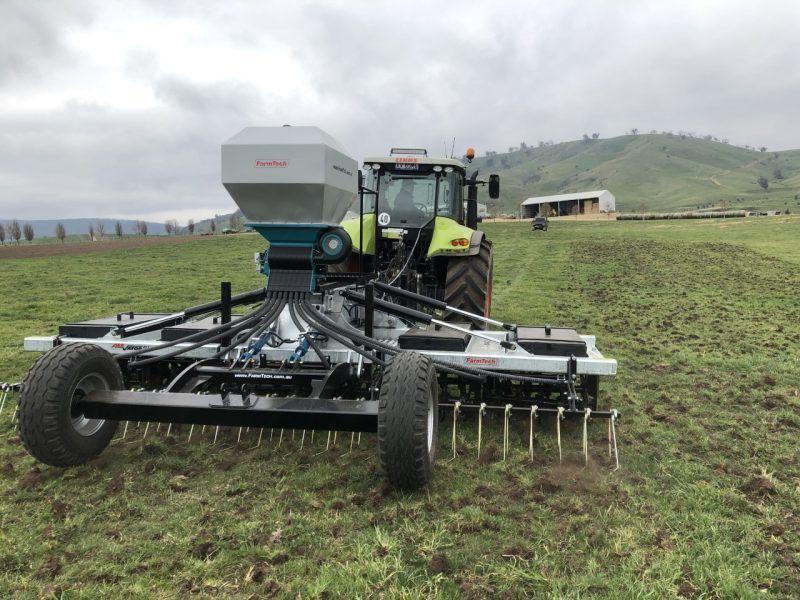
Managing pastures efficiently is a cornerstone of sustainable livestock production, requiring careful attention to tasks like mowing, aerating, seeding, and fertilizing. The multifunctional pastoral management machine is a game-changer, combining several of these tasks into a single, versatile unit. These machines are designed to improve pasture health, increase livestock productivity, and...
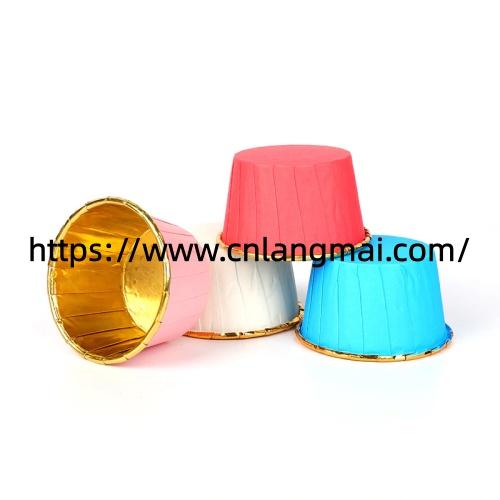
Aluminum Foil Cupcake Liners are considered by bakeries, wholesalers, food manufacturers, and retailers that need practical packaging for baked products and related applications. Before placing an order, buyers should examine material specifications, finished dimensions, heat conditions, appearance, customization possibilities, packing quantities, and supplier communication. Current packaging...
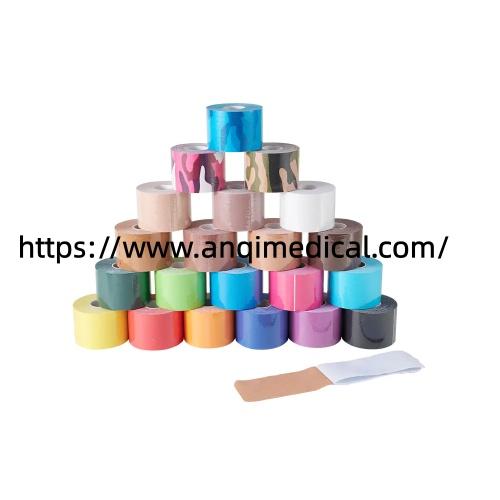
Precut Kinesiology Tape For Knee is attracting attention among fitness enthusiasts, sports participants, and people interested in convenient athletic support products. Whether preparing for a gym session, outdoor activity, or rehabilitation routine, users often look at product design and application methods before making a purchase. Convenience is an important part of this decision. Ready...